Our non-discretionary expenditure, which comprises personnel emoluments and debt stands at 50.1% and 40% respectively, giving a total of 90.1% of our annual budget. This leaves the discretionary expenditure amount to stand at 9.9% of our annual budget. This Mr. Speaker is an alarming ratio.
I initially thought that the president's speech writers had gotten their facts wrong around debt expenditure -- surely our debt service payments weren't as high as the president was making them out to be?
I was compelled to factcheck this statement all the while hoping against hope that the president, or his speechwriters, were wrong.
The most sensible way of fact checking this is to compare the president's statement with the official position on debt expenditure as contained in the 2019 Budget Address. According to the budget, the total amount of money set aside for debt service payments for 2019 was K24billion (K9billion for domestic debt and K15billion for external debt). Total expenditure for the budget as a whole was K87billion. This gives a debt expenditure share of 28%.
So did the president exaggerate the budget's debt share by a whole 12 percentage points? Not exactly.
Recall that in August of this year, the new Minister of Finance Dr. Bwalya Ng'andu asked parliament to approve a supplementary budget of K9.8billion. Dr. Ng'andu wanted the extra money to mostly pay for unexpected increases in debt service payments as a result of a weaker Kwacha among other reasons. Adding the amount that Dr. Bwalya asked for brings the total debt expenditure for 2019 to K34billion, representing a budget share of 35%. A number that's very close to what the president said in the National Assembly. (I invite better informed readers to figure out what might account for the 5 percentage points difference between what the president said and what I have estimated here).
Have we always spent this much of our budget on servicing debt? Figure 1 below shows that debt service payments were only 9% of the budget in 2009 and began to grow at alarming rates starting about 2015. By 2019, the debt service share in the budget was 28% (35% if you add the supplementary expenditure). So the share of the national budget dedicated to debt has grown by over 200% from 2009 to 2019 and is now at least a third of the budget if not more!
 |
| Figure 1: Total Debt Service Share in the National Budget Source: Various National Budgets |
It's also interesting to figure out what the structure of debt payments has looked like over this period. In other words, what has been the share due to domestic debt payments versus external debt payments?
Figure 2 provides this split. From 2009, the external debt expenditure share in the budget was very small (at 2.4%) and less than the domestic share (at 6.4%). However, beginning in about 2013, the external debt share began to increase rapidly so that by 2019, the budget was spending 17% on servicing external debt and spending 10% on domestic debt service. And servicing external debt is a Herculean effort because you need to use precious, and hard to earn, foreign currency to do it.
 |
| Figure 2: Total, Domestic and External Debt Shares in National Budget Source: Various National Budgets |
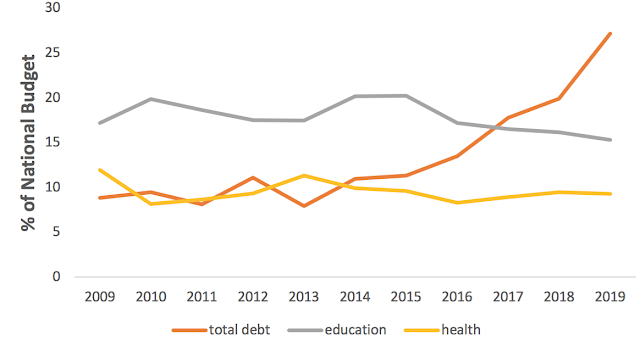
Finally, it's worth comparing the budget's expenditure on debt payments versus expenditure on what most citizens would deem as desirable expenditures over this period.
Figure 3 provides this information. In 2009, the shares of the budget dedicated to education (17%) and health (12%) were both greater than the share allocated to total debt service (9%). Today, the opposite is true -- the total debt share in the budget far exceeds the shares allocated to education and health combined!
 |
| Figure 3: Total Debt Share, Education Share and Health Share in National Budget Source: Various National Budgets |
A closer inspection of Figure 3 suggests that the health share, for example, begins to decline around about the time that the total debt share begins to explode (the response in the education share is a little bit delayed). Any student of social sciences, however, knows that correlation is never proof of causation -- in other words, the declines in the health and education shares may have nothing to do with the increase in the total debt share even though they both happen at the same time.
We do, however, have some very good scholarly evidence that the relationship depicted in Figure 3 is likely to be causal especially in sub-Saharan Africa. In other words, the declines in the health and education shares in Figure 3 are very likely caused by increases in debt service payments. And this is likely to get worse as debt service payments continue to occupy ever bigger chunks of the national budget going forward.